Aptana is a cool IDE for HTML, JavaScript and CSS with features like content assist,cool documentation,error listings etc. There is much more than just content assist or documentation in aptana. It can debug the client side of your web application.
It uses an extension to talk with firefox's JavaScript engine, which provides all the information about the JavaScript variables, HTML DOM elements,.... anything in the web page.
Debugging a web page
- To debug a web page, use the 'DEBUG' functionality and debug it as "JavaScript Web Application".
- Now you will be prompted for installing a FireFox extension. Click "Install".
- Restart Firefox.
- Again do the first step.
- Now the browser will be started by Aptana. Insert a breakpoint in your web page as shown below.
- Do some action in the browser so that the event is fired and now you will see a debug control in the margin showing the current debugging line.

Now you will be able to see something like this:
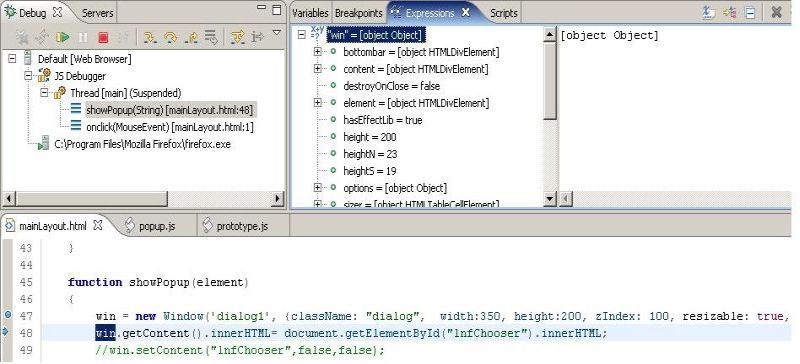
Features :
- Use the mouse pointer to inspect the objects
- Or use the expressions view to add expressions and
- have fun with JavaScript.............................

No comments:
Post a Comment